TeeChart VCL/FMX
€39,00
Charting components for RAD Studio, Delphi, C++ Builder, FireMonkey
TeeChart Pro charting component library offers hundreds of graph styles in 2D and 3D for data visualisation, 56 mathematical, statistical and financial functions for you to choose from together with an unlimited number of axes and 30 Palette components.
Brand: Steema
Language: English
Description
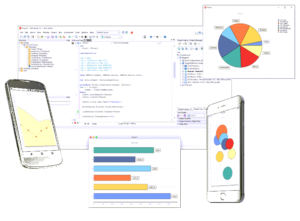
One source for cross-platform
Targeting Windows, Web and Mobile
Create one multi-platform project using Embarcadero’s RAD Studio and by using the same chart component you can reach Windows, Linux, iOS, Android and macOS.
Design the forms in the IDE and build/run them to any of the platforms on the list.
You can also use TeeChart (sourcecode version only) with FMXLinux to port/build your charting applications to/for Linux with Embarcadero Delphi 10.2 Tokyo and up.
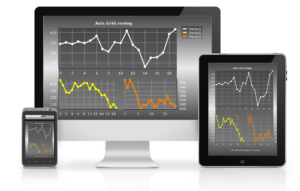
Responsive charts
Deliver dashboards easily to multi-device/multiple platforms with FireMonkey
TeeChart will scale and fit to any screen size. If you’re building dashboards you can place multiple, resizeable charts on each dashboard panel. FireMonkey framework will handle most of the variations for the different platforms.
Charts for every industry
Business, financial and scientific data
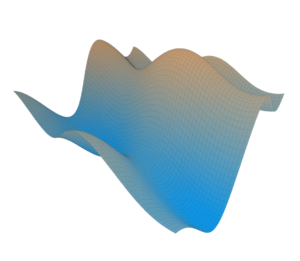
The VCL component offers an immense array of charts to display your data in the most effective and manageable way. Over 60 chart types with 2D and 3D views – from common bar, line, area graphs to financial and statistical charts.
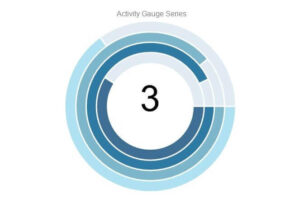
Gauges easily customized
Interactive gauge indicators including circular, linear and digital gauges
The Chart component provides many gauges series type and indicators to create digital dashboards with visual effects like shadows, lighting, etc.
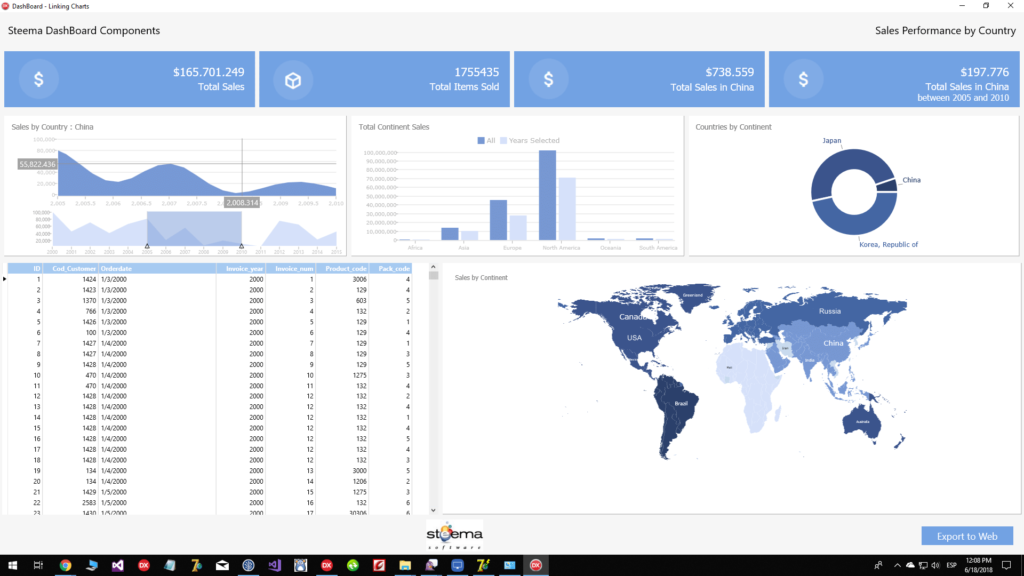
Dashboard and Reporting
Build informative dashboards with the data visualisation tools
This Delphi FireMonkey project provides a dashboard report containing charts, grid and map. It uses several TeeChart features in order to interact between the different chart and grid, as well as some chart tools. The dashboard represents the sales activities of a company with products in several markets around the globe.
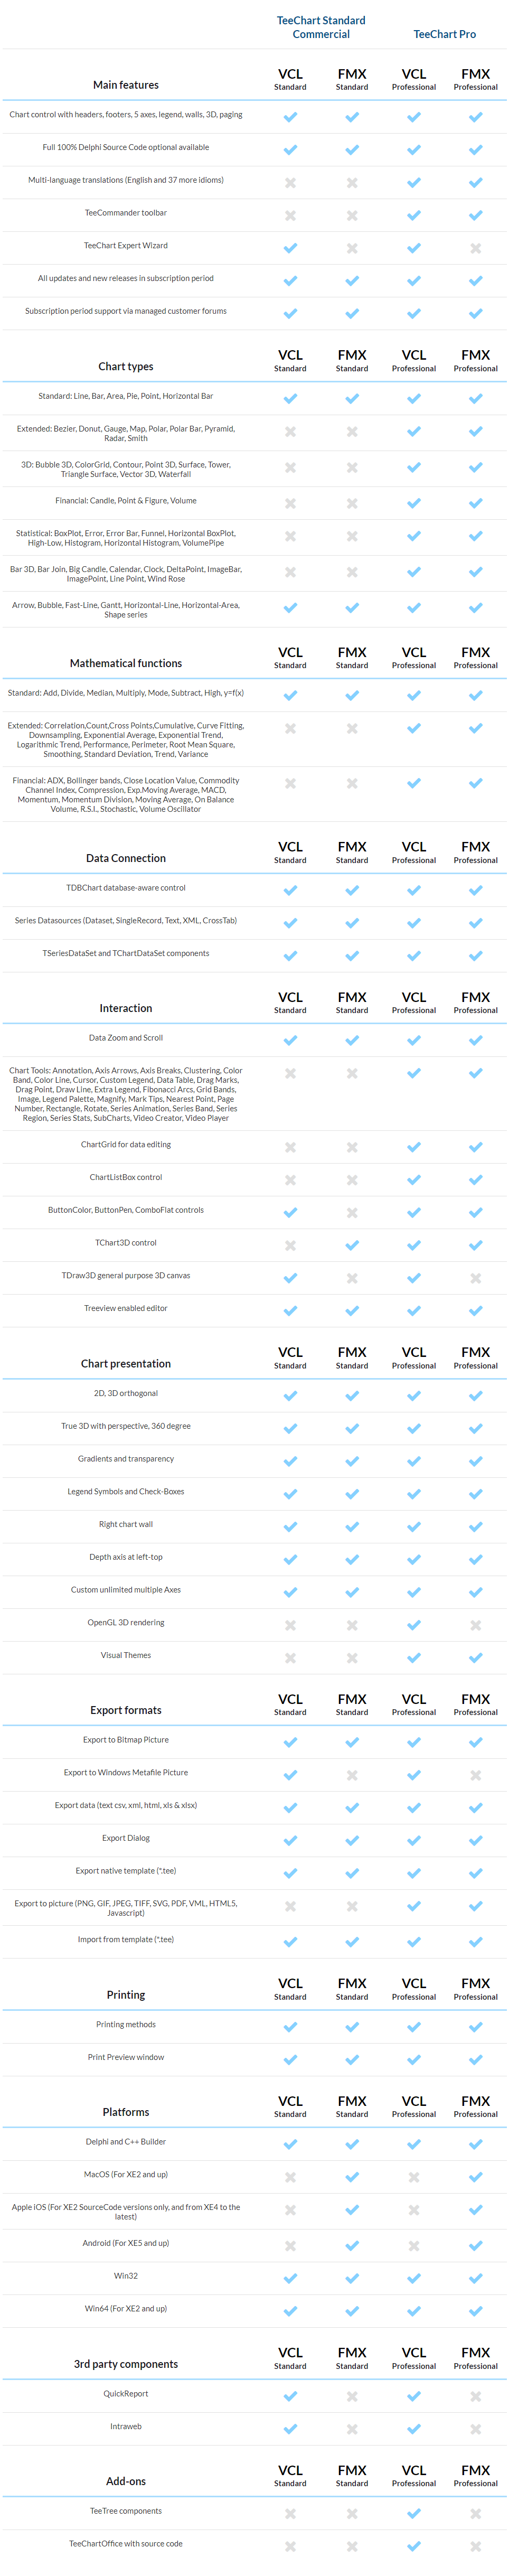
Feature Comparison
Please refer to the table below to learn which features are supported by the different TeeChart versions.